

A Practical Brand Community Analytics Guide for Modern Teams
How to Measure What Your Brand Community Delivers
A brand community analytics guide should start with a business goal, not a list of every number you can collect. If your goal is better support, track answered questions and support tickets. If it is loyalty or growth, track returning members, referrals, and renewals. Define what counts as an active member, then compare those measures over time. Sign-ups and posts alone cannot prove impact.

Your community data can show what people do and what they need. Pair those numbers with member feedback, then connect them to your support and customer records. I’m Jock Breitwieser, and I’ll walk you through a practical way to measure what matters as your community grows.
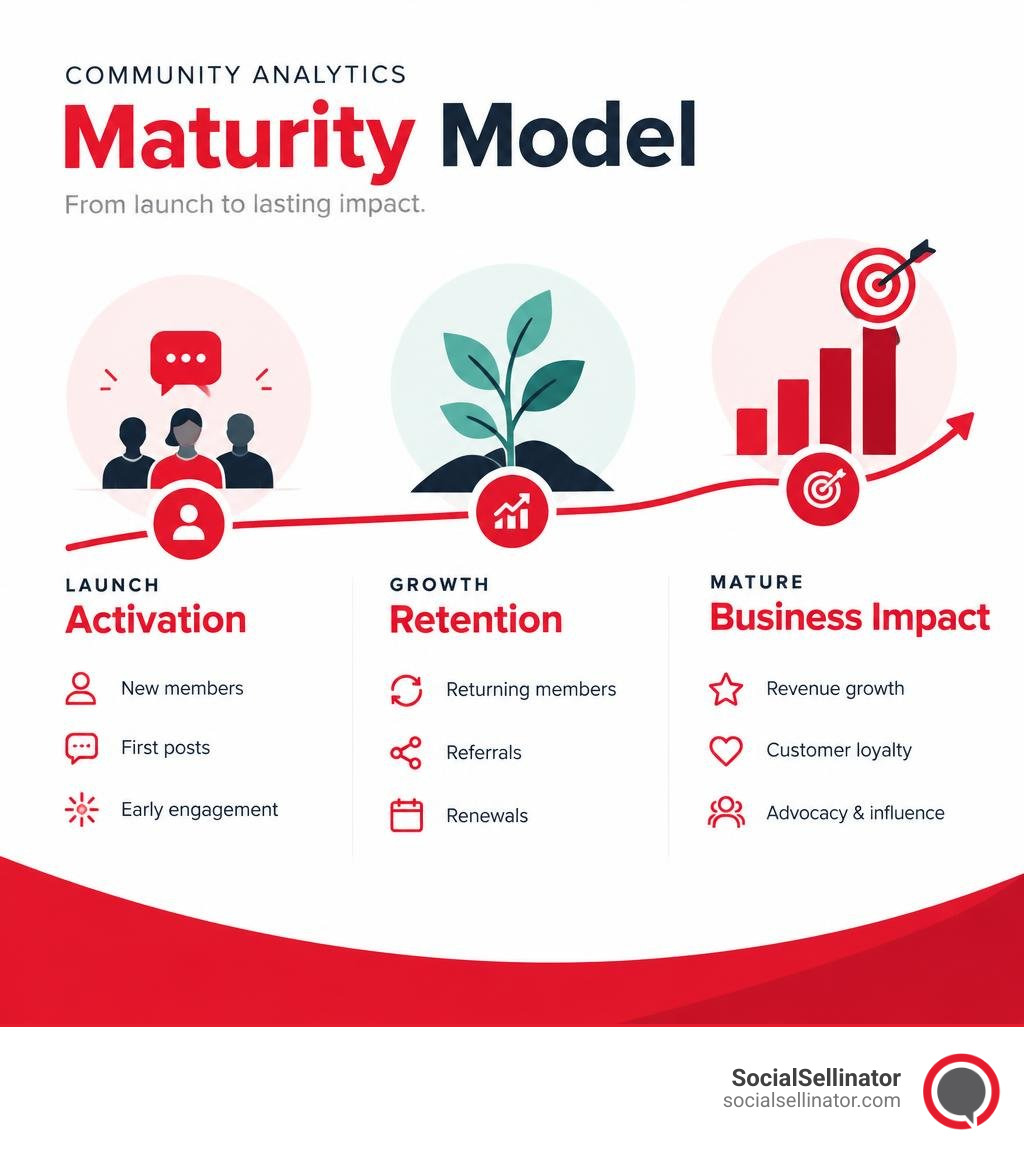
Essential brand community analytics guide terms:
The Strategic Brand Community Analytics Guide: Categorizing Metrics from Health to Impact
Measuring an online space requires structured discipline. In today’s digital landscape, over 60% of consumers regularly interact with automated discovery tools and AI summaries, making owned customer relationships more valuable than ever. Meanwhile, roughly 83% of buyers actively expect authentic, two-way conversations with brands.
When establishing your measurement framework, you cannot treat every single data point with equal weight. Tracking total pageviews tells you almost nothing about whether your members feel supported, inspired, or ready to renew their contracts. To build clarity, we use a three-tier pyramid framework that categorizes community data from ground-level platform operations up to bottom-line business revenue.
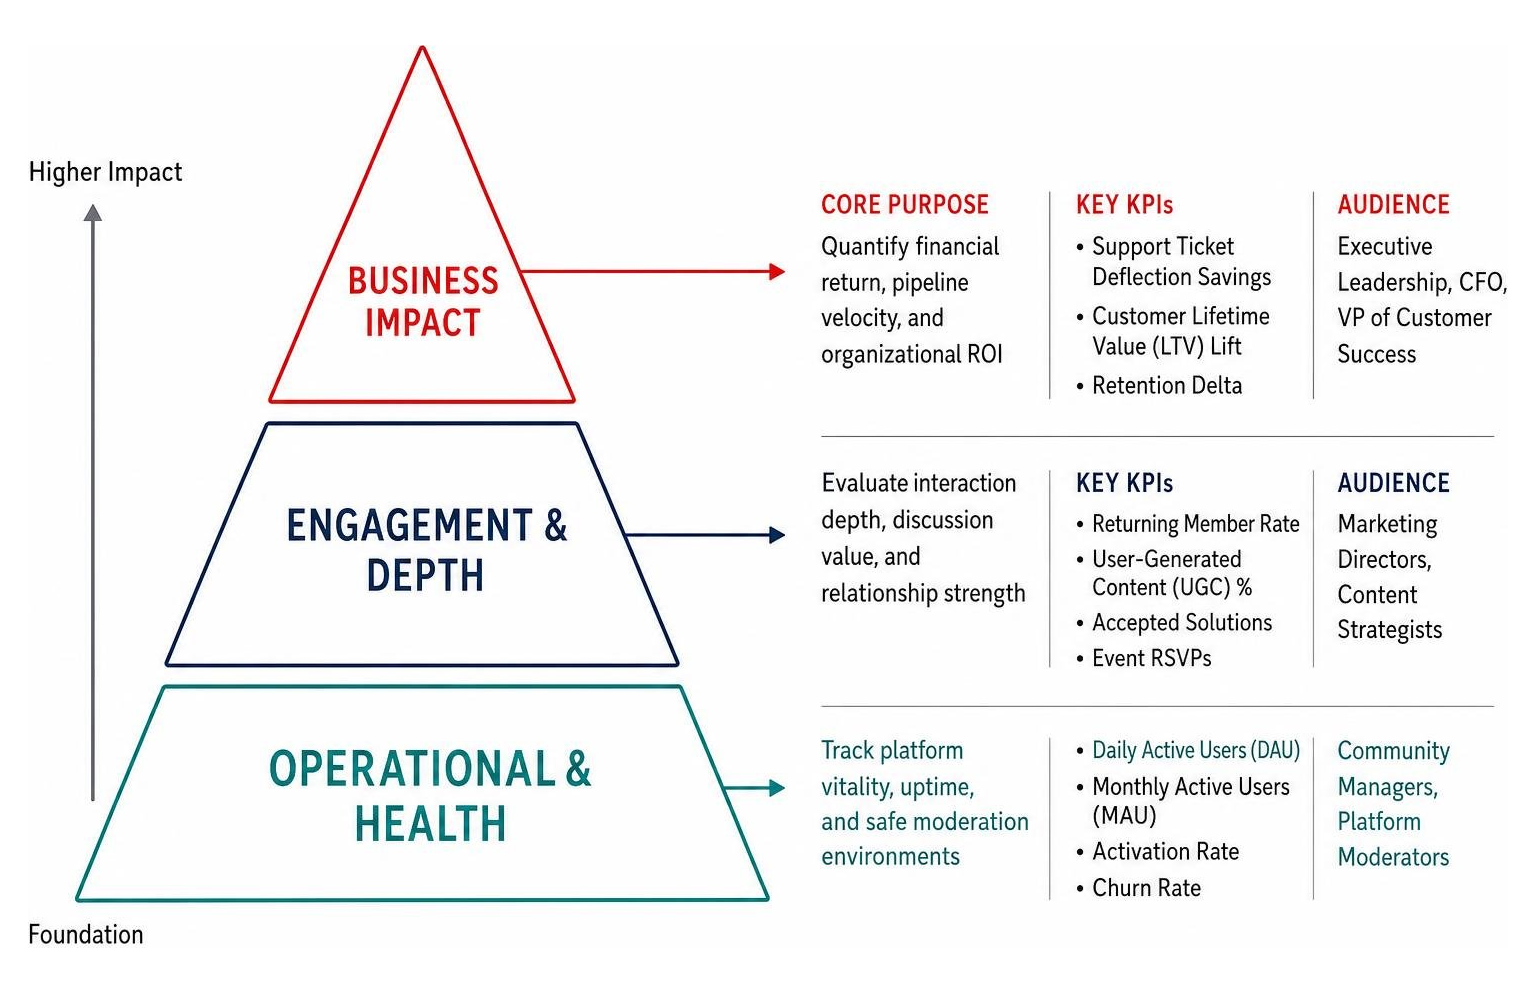
| Metric Tier | Core Purpose | Typical Key Performance Indicators (KPIs) | Primary Stakeholder Audience |
|---|---|---|---|
| Operational & Health | Track platform vitality, uptime, and safe moderation environments | Daily Active Users (DAU), Monthly Active Users (MAU), Activation Rate, Churn Rate | Community Managers, Platform Moderators |
| Engagement & Depth | Evaluate interaction depth, discussion value, and relationship strength | Returning Member Rate, User-Generated Content (UGC) %, Accepted Solutions, Event RSVPs | Marketing Directors, Content Strategists |
| Business Impact | Quantify financial return, pipeline velocity, and organizational ROI | Support Ticket Deflection Savings, Customer Lifetime Value (LTV) Lift, Retention Delta | Executive Leadership, CFO, VP of Customer Success |
By structuring your approach around this hierarchy, you seamlessly tie everyday community actions to broader social media marketing measurement initiatives without overwhelming your executive team with operational minutiae.
Foundational Health and Operational Metrics
Operational health serves as the foundation of your community ecosystem. If your space lacks basic activity or suffers from high member attrition, higher-level engagement strategies cannot gain traction.
The most fundamental operational benchmark is your ratio of Daily Active Users (DAU) to Monthly Active Users (MAU), which measures engagement stickiness. However, what qualifies as “healthy” scales inversely with total membership size:
- Small communities (<50 members): Median MAU rate sits around 54%.
- Medium communities (51–500 members): Median MAU rate averages 38%.
- Large communities (>500 members): Median MAU rate stabilizes near 20%.
Furthermore, roughly 75% of community managers identify total active members as their most consistently tracked operational metric. Alongside active membership counts, you must track onboarding activation rates—measuring the percentage of new sign-ups who complete an initial action (such as introducing themselves, commenting, or completing a profile) within their first 30 days. In healthy programs, 30% to 50% of new members cross this activation threshold.
Finally, keep a close watch on monthly member churn. Monthly churn below 2.5% represents exceptional retention, while rates between 2.5% and 5% are very healthy. If monthly account deactivations or drop-offs exceed 15%, it serves as an immediate operational red flag signaling poor onboarding or platform friction.
Using This Brand Community Analytics Guide to Track Engagement vs Health
While operational health confirms that members are present, engagement metrics evaluate the substance and quality of their participation. A community with thousands of silent logins provides little long-term commercial value compared to a focused space filled with dynamic peer-to-peer collaboration.
To understand true depth, examine the distribution of user-generated content (UGC). Calculate your UGC percentage by dividing member-created posts by the total volume of community posts (including staff announcements), then multiplying by 100. In maturing spaces, member-led discussions should represent the majority of activity:
- Small communities often see around 20% member-generated posts.
- Medium spaces reach approximately 46%.
- Scaled, thriving communities achieve upwards of 74% member-driven contributions.
This dynamic aligns directly with the classic Pareto 80/20 principle: roughly 20% of your power users will generate 80% of total discussion volume.
Tracking meaningful social media audience engagement also requires monitoring your Returning Member Rate and event participation. In-person brand events typically yield attendance rates above 60%, whereas virtual community webinars and roundtables are considered highly successful when attendance exceeds 30%. Tracking these participation markers prevents teams from confusing passive lurking with genuine affinity.
Business Impact and Revenue Attribution Metrics
The pinnacle of your measurement framework connects member actions directly to financial outcomes. To secure sustained executive sponsorship and budget, you must demonstrate how community programs reduce operating overhead or expand top-line earnings.
Core business impact indicators include:
- Customer Retention Lift: Comparing renewal and retention rates between community members and non-members across identical cohorts. Brands with active brand communities frequently realize retention gains exceeding 50%.
- Customer Acquisition Cost (CAC) Reduction: Measuring organic referrals, member-generated content rankings, and community-driven trials that reduce reliance on paid acquisition channels.
- Customer Lifetime Value (LTV) Expansion: Tracking the accelerated adoption of higher product tiers, add-ons, or repeat purchase frequency among engaged community advocates.
- Sales Pipeline Acceleration: Monitoring how prospective buyers who participate in public enablement threads or peer discussions progress through deal stages faster than disengaged prospects.
Transforming these insights into measurable pipeline growth forms the core of analytics for action turning insights into conversions.
Structuring Metrics by Community Type and Business Objective
Not all brand communities share the same primary mission. A developer-focused technical hub requires a fundamentally different analytics scorecard than an exclusive luxury lifestyle circle. In fact, research indicates that 59% of premium and luxury consumers place immense value on belonging to exclusive brand communities, while enterprise software buyers prioritize immediate problem resolution and technical peer validation.
Effective community management begins by selecting key performance indicators that map precisely to your community’s intended functional model.
Support and Self-Service Communities
Support-oriented communities focus on customer satisfaction, peer assistance, and customer service cost reduction. When users find reliable answers from fellow peers, your internal support staff avoids handling repetitive inbound inquiries.
Essential metrics for support spaces include:
- Median Time to First Response: Tracking how quickly a user’s question receives an initial comment, whether from staff or community super-users.
- Accepted Solutions Count: The total number of forum threads where an answer is verified as correct by the original poster or moderator.
- Solution Rate: The percentage of total submitted inquiry threads that reach a verified resolution.
- Support Escalation Rate: The proportion of community questions that fail to resolve peer-to-peer and require routing to formal ticketing queues. Rising escalation rates frequently highlight underlying product flaws rather than moderation issues.
Advocacy and Ambassador Programs
Advocacy communities mobilize your most enthusiastic customers to expand reach, generate authentic reviews, and champion your brand across public channels. For high-growth organizations, learning how to turn your brand community into a raving fanbase produces tangible organic expansion.
Key advocacy metrics include:
- Net Promoter Score (NPS) & CSAT: Regularly evaluating advocacy cohorts to ensure community participation actively elevates brand perception.
- Advocate-Driven Referral Volume: Measuring sign-ups, leads, and sales originating from unique ambassador links and referral codes.
- UGC Creation & Syndicate Volume: Tracking customer testimonials, social media mentions, unboxing videos, and use-case spotlights generated by community members.
- Review Generation: Monitoring the volume of verified, positive reviews submitted to third-party marketplaces and software review platforms.
Enablement and Communities of Practice
Communities of practice bring professionals together around shared craft, industry challenges, and product mastery. These spaces prioritize knowledge exchange, professional development, and feature adoption.
Crucial enablement metrics include:
- Product Feature Adoption Velocity: Tracking how quickly community members implement newly released workflows or product features compared to non-members.
- Session Duration and Content Consumption: Measuring the depth of engagement with educational articles, tutorials, and recorded masterclasses.
- Ideation & Co-Creation Submissions: Counting the number of feature suggestions, templates, or workflows submitted by members that are subsequently incorporated into product roadmaps.
- Time-to-Value (TTV) Compression: Monitoring how community onboarding cohorts achieve core product milestones faster than isolated users.
Calculating Community ROI: Support Deflection and Revenue Attribution
Demonstrating community return on investment requires bridging community telemetry with corporate financial accounting. Rather than relying on vague estimates of brand sentiment, your team can deploy established formulas that prove fiscal contribution, following the exact financial rigor explored in our guide on how to measure roi of social media marketing.
Deflection Formulas and Cost Savings
Support deflection occurs when a customer resolves an issue by reading existing community discussions rather than opening an expensive customer support ticket.
Across the tech and services industry, handling a single standard support ticket through email, live chat, or phone costs an average of $15 to $20. You can conservatively estimate ticket deflection volume using verified content interaction rates:
- Accepted Answer Pageviews: Approximately 1 in every 5 views (20%) on a thread with a verified accepted solution deflects a formal support ticket.
- General Discussion Views: Approximately 1 in every 20 views (5%) on general self-service knowledge base topics results in a deflected inquiry.
To determine your total financial cost savings over a given period, calculate total deflected tickets as (accepted answer views × 0.20) plus (general discussion views × 0.05), and multiply that sum by your internal cost per support ticket.
For instance, if your community generates 10,000 views on accepted solution threads and 40,000 general troubleshooting views per quarter, with an internal cost of $18 per support ticket:
- Accepted Solution Deflections: 10,000 × 0.20 = 2,000 tickets
- General Views Deflections: 40,000 × 0.05 = 2,000 tickets
- Total Deflected Tickets: 4,000
- Total Quarterly Support Savings: 4,000 × $18 = $72,000
Pipeline Influence and Customer Lifetime Value Lift
Beyond operational cost reduction, mature brand communities actively generate and protect top-line revenue. Proving this requires cohort segmentation, comparing the behavioral lifetime value of community participants against unengaged customer accounts.
To demonstrate pipeline attribution:
- Isolate Comparable Customer Segments: Group customers by acquisition date, company size, and product tier.
- Track Retention Differentials: Measure the annual churn rate difference. If non-member accounts churn at 12% annually while engaged community members churn at just 6%, the retained recurring revenue directly attributes to your community program.
- Measure Expansion Velocity: Calculate average expansion revenue (upsells, cross-sells, account expansion) across both cohorts. Community members routinely demonstrate 15% to 30% higher annual contract expansion due to ongoing product education and peer inspiration.
- Attribution Tagging: Utilize custom UTM tracking codes and CRM campaign tags for all community-hosted webinars, partner spotlights, and exclusive downloadable assets.
Tech Stack Architecture and Multi-Source Data Integration
To build an authoritative community reporting engine, you must dismantle data silos. Modern research highlights that only 39% of enterprise companies possess a unified customer data platform ready to support advanced data modeling and autonomous agent rollout. Without seamless martech integration, valuable community interactions remain isolated from your broader customer intelligence systems.
Advanced social media analytics demand a tech stack that links front-line conversations with core transactional records.
Connecting Owned Platforms to CRMs and CDPs
Housing your community on owned or dedicated platforms provides complete control over your first-party member data, unlike third-party social networks. To maximize this strategic advantage, configure API webhooks and data pipelines that sync member profiles into your core CRM and customer data platforms.
A fully integrated architecture synchronizes:
- Profile Enrichment: Logging community registration dates, activity levels, badges earned, and discussion topics directly onto customer contact records.
- Automated Lifecycle Triggers: Prompting customer success managers when a high-value account becomes inactive in the community, or alerting account executives when a customer asks questions about advanced enterprise features.
- Closed-Loop Attribution: Ingesting structured community event registrations, masterclass attendance, and resource downloads into marketing automation platforms to establish exact multi-touch conversion attribution.
Blending Quantitative Analytics with Qualitative Sentiment
Pure numeric data outlines what is occurring in your community, but qualitative insights explain why it is happening. Relying strictly on raw activity charts creates strategic blind spots.
To capture the complete narrative:
- Deploy Natural Language Processing (NLP) Sentiment Tracking: Monitor discussion feeds for shifts in sentiment polarity (positive, neutral, negative). A sudden surge in negative sentiment following a pricing update or product release provides an early warning mechanism before issues appear in churn metrics.
- Conduct Recurring Member Discovery Interviews: Supplement monthly reporting with direct feedback gathered from VIP contributors, lurkers, and recently churned members.
- Tag Unsolicited Feedback Loops: Systematically categorize user-submitted bug reports, usability complaints, and feature requests, feeding organized voice-of-customer digests directly into product engineering sprints.
Reporting Cadence, Governance, and Avoiding Common Analytical Pitfalls
Collecting community data is only half the battle; presenting it effectively to organizational stakeholders determines whether your program secures ongoing investment. Establishing an executive-ready reporting cadence prevents data fatigue while demonstrating strategic business alignment.
Implementing a Brand Community Analytics Guide for Stakeholder Reporting
To ensure your analytics drive action, establish a tiered reporting cadence:
- Weekly Operational Pulse (Internal Community Team): Monitor immediate operational metrics, including new member sign-ups, moderation queues, unresolved support questions, and weekly active users.
- Monthly Health & Performance Deep Dive (Departmental Leadership): Review month-over-month trends in user-generated content volume, accepted solution rates, event RSVPs, and sentiment distribution.
- Quarterly Business Review (Executive Stakeholders & CFO): Present high-level business impact figures, including support deflection cost savings, pipeline influence, customer retention deltas, and strategic voice-of-customer recommendations.
When presenting to senior executives, structure every data point around the “So What?” principle. Rather than simply stating, “Community event attendance increased by 25% this quarter,” frame the accomplishment through business impact: “A 25% increase in virtual workshop attendance contributed to a 14% faster adoption of our new enterprise module across participating accounts.”
Overcoming Vanity Metrics and Data Misinterpretation
Misinterpreting data can derail community strategy faster than a lack of data altogether. Avoid these common analytical pitfalls:
- Chasing Raw Member Headcount: Celebrating 50,000 registered accounts is meaningless if 98% of those profiles have been dormant for six months. Prioritize active contribution and retention over vanity registration totals.
- Misjudging Time on Site: High average session duration is not universally positive. In an enablement community, long dwell times can signify deep content engagement; in a support forum, excessively long session durations often mean users are struggling to find straightforward answers.
- Ignoring the Lurker Ratio: In virtually every digital community, the standard 90-9-1 rule applies—90% of members consume content silently (lurkers), 9% interact occasionally, and 1% create the vast majority of original content. Attempting to force every lurker into becoming a heavy poster will distort your engagement strategy. Silent consumption still yields high brand affinity, product adoption, and ticket deflection.
- Reporting Snapshots Instead of Longitudinal Trends: A single-month spike in post volume might simply reflect a temporary product bug that prompted confusion. Always evaluate performance across rolling 90-day and year-over-year windows.
Frequently Asked Questions About Brand Community Analytics
What is the most critical metric for tracking active community health?
The most reliable baseline metric for overall community health is the Monthly Active Users (MAU) engagement rate relative to total community scale, combined with your 30-day member retention curve.
Tracking the percentage of members who actively contribute (post, comment, react, or attend an event) rather than merely logging in gives you an accurate pulse on platform vitality. For communities exceeding 500 members, maintaining an active participation rate around 20% indicates strong operational health.
How do you accurately calculate support ticket deflection value?
Support deflection value is calculated by identifying the number of community visits that successfully resolve customer issues, then multiplying that total by your internal cost per support ticket (typically $15 to $20).
Industry-standard modeling attributes a deflection to approximately 20% (1 in 5) of pageviews on threads with accepted solutions, and 5% (1 in 20) of views on general self-service discussion topics. Multiplying total deflected inquiries by your internal cost per ticket provides your net financial savings.
How does community analytics differ from standard social media analytics?
Standard social media analytics evaluate public distribution metrics—such as impressions, top-of-funnel reach, viral shares, and third-party follower counts across public algorithms.
Community analytics focuses on deep behavioral interaction, relationship health, and long-term retention within an owned environment. It provides direct, first-party data ownership, user identity resolution, and the ability to map individual community engagement directly to customer CRM profiles, product usage logs, and financial lifetime value.
Conclusion
Building a high-impact brand community requires moving beyond surface-level vanity metrics to embrace a structured analytics framework. By connecting operational health, meaningful engagement, and financial business outcomes, modern teams can clearly demonstrate tangible ROI—from measurable support deflection savings to accelerated pipeline velocity and customer retention. When data guides your community strategy, your community transforms from an unmeasured social initiative into an indispensable growth engine.
Ready to elevate your digital presence, build loyal customer communities, and turn analytics into measurable revenue? Partner with our team to deploy comprehensive social media management services tailored to your specific growth objectives.
Headquartered in San Jose, in the heart of Silicon Valley and the San Francisco Bay Area, SocialSellinator proudly provides top-tier digital marketing, SEO, PPC, social media management, and content creation services to B2B and B2C SMB companies. While serving businesses across the U.S., SocialSellinator specializes in supporting clients in key cities, including Austin, Boston, Charlotte, Chicago, Dallas, Denver, Kansas City, Los Angeles, New York, Portland, San Diego, San Francisco, and Washington, D.C.